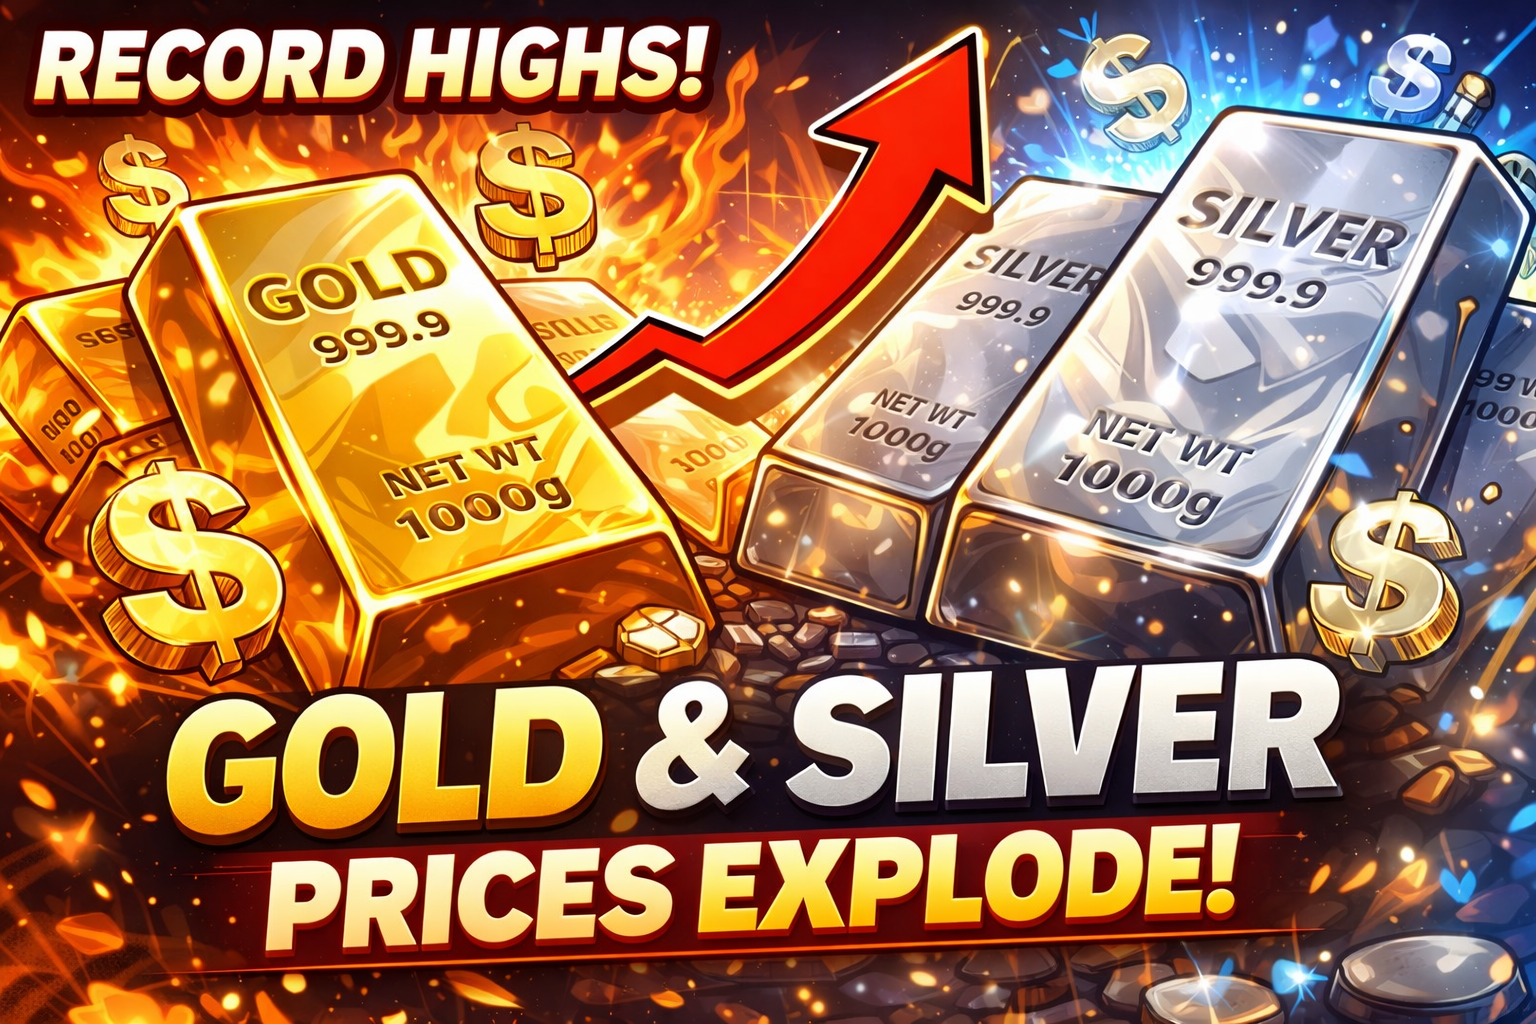
Gold & Silver Prices Smash New All-Time Highs
Why the world’s two most famous precious metals are exploding to record levels – and what this super-cycle means for investors, traders and the global economy.
The Moment: Record Highs for Gold and Silver
In late December 2025, gold and silver broke into territory the market has never seen before. Spot gold pushed above the $4,500 per ounce mark, with several data providers reporting intraday highs in the $4,500–$4,550 range – more than 70% higher than where the metal traded at the start of the year. :contentReference[oaicite:0]{index=0}
Silver followed with an even more violent move. Prices vaulted past $70, then spiked into the high $70s per ounce as year-end trading intensified. According to multiple market feeds and newswires, silver’s 2025 rally has exceeded 140%–170%, making it one of the strongest annual precious-metal moves since the late 1970s. :contentReference[oaicite:1]{index=1}
These new peaks do not exist in isolation. They cap a multi-year climb that began with gold clearing the $2,000 resistance zone in 2020–2023 and accelerated in 2024–2025 as inflation stayed sticky, global debt ballooned and investors increasingly questioned the long-term stability of fiat currencies. :contentReference[oaicite:2]{index=2}
Gold: New All-Time High
Trading platforms and news services show spot gold around $4,500–$4,550/oz, up roughly 70%+ year-to-date and marking dozens of new records in 2025 alone. :contentReference[oaicite:3]{index=3}
Silver: Breakout to Record Territory
Silver has broken every prior high, with intraday prints in the high $70s and an annual gain well above 140%, driven by both safe-haven flows and industrial demand. :contentReference[oaicite:4]{index=4}
Relative Performance (2025 YTD)
Analysts estimate gold up roughly 60–75% this year, while silver has surged between 120% and 170%, making it the standout performer in the precious-metals complex. :contentReference[oaicite:5]{index=5}
Understand the Money System Behind the Gold Super-Cycle
Huge moves in gold and silver don’t happen in a vacuum. They’re reactions to debt, currency dilution and policy choices. “Bitcoin: The Sovereign Protocol” from BrainRotLabs.fun is our field guide to how money, credit and digital assets evolve when old systems get stressed.
If you want to read gold’s chart the way insiders read a balance sheet, this is your blueprint.
Explore the BookMacro Drivers: Why Gold and Silver Are Exploding Higher
Several forces converged in 2025 to push precious metals into a full-blown breakout. On the macro side, markets expect a sequence of interest-rate cuts from the U.S. Federal Reserve and other central banks after one of the fastest tightening cycles in modern history. Lower real yields reduce the opportunity cost of holding non-yielding assets like gold and silver, and futures pricing now implies a multi-year easing path. :contentReference[oaicite:6]{index=6}
At the same time, the U.S. dollar index has trended lower as rate expectations shift and fiscal deficits remain steep. A weaker dollar mechanically lifts the dollar price of globally traded commodities and also encourages central banks and sovereign wealth funds to diversify their reserves. :contentReference[oaicite:7]{index=7}
Geopolitics added another tailwind. Escalating tensions in the Middle East, renewed instability in parts of Latin America and Africa, and ongoing conflict zones in Eastern Europe have all contributed to elevated demand for safe-haven assets. News of sanctions, shipping disruptions and regional crises has repeatedly coincided with sharp intraday surges in gold prices throughout the year. :contentReference[oaicite:8]{index=8}
Finally, the sheer size of public-sector demand has been remarkable. Data compiled by market analysts and the World Gold Council indicate that central banks collectively added more than 1,000 tonnes of gold to their reserves for the third consecutive year, with strong buying from China, India and Poland among others. This structural demand has helped absorb supply and signalled to private investors that official institutions are voting with their balance sheets. :contentReference[oaicite:9]{index=9}
Silver’s Dual Identity: Industrial Workhorse and Monetary Metal
Silver’s outperformance in 2025 is not only a leverage play on gold. It also reflects the metal’s dual role as both an investment asset and a critical input for modern technology. Solar panels, EV components, high-end electronics and emerging power-grid infrastructure all rely heavily on silver’s conductivity and reflective properties.
Industry research highlights that the silver market has run repeated deficits since 2021, with cumulative shortfalls over 800 million ounces – essentially wiping out an entire year of mine-supply equivalent. When investment demand finally accelerated alongside gold’s breakout, the market ran into a structural shortage, forcing prices sharply higher. :contentReference[oaicite:10]{index=10}
Retail sentiment has shifted as well. Surveys from bullion dealers and research firms show a majority of small investors now expecting silver to eventually trade above $100 per ounce, a psychological target that was considered unrealistic only a few years ago. :contentReference[oaicite:11]{index=11}
This combination – chronic supply tightness, surging industrial use and speculative interest – is what makes silver behave like “gold on leverage” when the macro environment turns friendly.
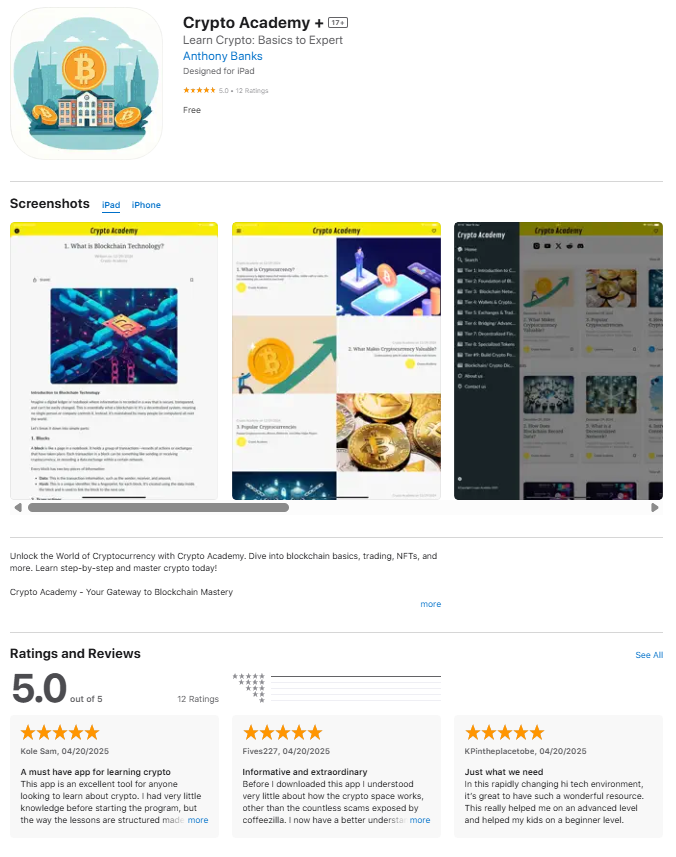
From Gold Bars to On-Chain Assets
Precious metals are one pillar of the “hard asset” world. On-chain assets and tokenized products are another. The BrainRotLabs Crypto Academy+ app walks you from beginner to advanced on Bitcoin, DeFi, NFTs and tokenization – so you can compare gold, silver and digital plays with the same mental toolkit.
Use metals as your baseline, then learn how to stack digital assets on top.
Open the AcademyRisks, Volatility and What Could Break the Trend
No super-cycle runs in a straight line. Gold and silver have both seen sudden air-pockets this year when traders took profits or repriced the path of interest rates. Sharp one-day drops of 5%– 10% have become common around major macro events, reminding investors that record prices amplify both gains and drawdowns. :contentReference[oaicite:12]{index=12}
A faster-than-expected decline in inflation, unexpectedly tight monetary policy or a strong resurgence in the dollar could all cool the rally. Likewise, if industrial activity slowed meaningfully, the demand side of silver’s thesis would weaken, leaving the metal more exposed to speculative flows.
On the supply side, sustained high prices will eventually incentivize new mining projects and recycling capacity. History shows that multi-year booms often sow the seeds of their own reversal as higher prices draw in new production. The timing of that adjustment, however, is inherently uncertain and heavily dependent on financing conditions and permitting timelines.
What the New Highs Signal About the Global System
The surge in gold and silver is ultimately a referendum on trust. Investors are paying record nominal prices for assets that do not depend on the solvency of any single government or corporation. Central banks are quietly doing the same thing at scale by adding to their bullion reserves year after year.
For everyday savers, the message is that relying solely on cash and traditional financial assets leaves them exposed to inflation, policy shifts and currency dilution. For institutions, the move signals that the “neutral reserve asset” narrative is alive again, decades after the formal end of the gold standard.
Whether this is the midpoint of a longer secular re-pricing or the late stage of an overheated rally will only be clear in hindsight. What is obvious right now is that gold and silver have escaped their old trading ranges and forced the world to pay attention.